Edo Danilyan
Edo Danilyan
Home
Experience
Projects
Talks
Publications
Contact
Notes
R
biocomp: Github repository for learning biocomputations
Hi guys, biocomp is a repository for my bioinformatics and computational biology learning journey. This repository includes scripts and data primarily focused on computational biology, covering a wide range of topics such as:
Edo Danilyan
Code
30 Day Chart Challenge: my contribution and tutorial
Welcome! This is a friendly and beginner-accessible open-source book created to help you explore the fascinating world of data visualization, one chart at a time. Through this project, I share:
Edo Danilyan
Code
Books
Dashboard Collection and Presentation Slides Samples
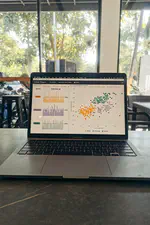
Overview I primarily use R Studio IDE for Exploratory Data Analysis, visualization, and statistical analysis. In this collection, I listed some of my dashboard created using flexdashboard package. This package allow me to visualise a dashboard using Rmd format.
Edo Danilyan
Last updated on Aug 30, 2026
1 min read
Analyzing My Spotify Playback Activity 2022
This article will include code chunks on how I analyze my Spotify playback pctivity in R language. The code chunks cover the data wrangling and data visualization.
Edo Danilyan
Last updated on Aug 30, 2026
5 min read
Module: Microbial Systematics Course
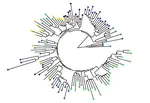
A hands-on learning module on computational microbiology, focused on microbial taxonomy, classification, and phylogenetic analysis using R.
Edo Danilyan
,
Sabila Fatimah
,
Enny Zulaika
Course Materials
portfolio
Interactive stories about climate, movement, music, food, microbes, and energy
Edo Danilyan
Last updated on Aug 16, 2026
4 min read
«
Cite
×