Edo Danilyan
Edo Danilyan
Home
Experience
Projects
Talks
Publications
Contact
Blog
R
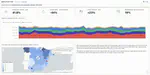
Spain Energy Generation Dashboard
Welcome! I came across this Kaggle dataset on Spain’s electricity generation and thought it would be fun to turn it into something a little more interactive. Instead of staring at rows of numbers, I wanted a way to explore how the country’s energy mix has changed over time and see how different energy sources compare.
Edo Danilyan
Dashboard
Storytelling with Data
A session on how to tell better stories using data, tailored for faculty and researchers at UMM.
Apr 21, 2026 9:00 AM — 12:00 PM
Universitas Muhammadiyah Malang
Edo Danilyan
Project
CoE GAP Project
LinkedIn Post
R for Biologists: Data Wrangling, Visualization, and Reproducible Analysis
Hands-on workshop shifting students from click-based workflows toward script-based and reproducible analysis using R.
Apr 14, 2026 9:00 AM — 12:00 PM
Institut Teknologi Sepuluh Nopember
Edo Danilyan
Project
CoE GAP Project
LinkedIn Post
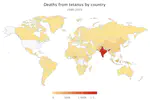
Characteristics of Microplastics in Water and Fish and Their Relationship with Migration from the East Coast of Surabaya, Indonesia
Microplastics (MP) contamination has become a crucial aspect of research concerning water environments including fish. The East Coast …
Aunurohim
,
Dian Saptarini
,
Abdus Junaedi
,
Shinta Dewi
,
Edo Danilyan
,
Hasan Adro’i
,
Prima Putra
,
Alfiah Hayati
PDF
DOI
R tutorial series: Choosing color for data visualization
A practical guide to categorical, sequential, and diverging color palettes in R, with visible swatches and reproducible ggplot2 examples.
Edo Danilyan
Last updated on Jul 23, 2026
5 min read
Storytelling with Data
A chill and practical session on how to tell better stories using data, especially for students in science and bioinformatics.
Jan 10, 2025 9:00 AM
Smartclass, Biology Department, Institut Teknologi Sepuluh Nopember
Edo Danilyan
Video
Watch Recording
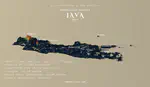
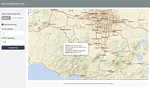
Shinyapp for biologist: apps and usage tutorial
Welcome! This is my first R Shiny project, a simple app for mapping species observation data. You upload a CSV with one row per observation (species name, site, abundance, latitude/longitude, conservation status, and habitat type), or tick a box to try it with built-in dummy data on Javan wildlife.
Edo Danilyan
Code
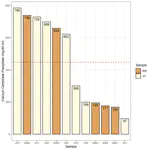
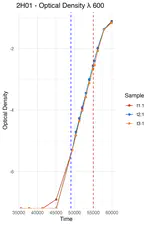
R tutorial series: Analyzing bacterial growth from OD600 data
This article will include code chunks on how I analyze bacterial growth of OD600 data
Edo Danilyan
Last updated on Jul 17, 2026
8 min read
Microplastic-Contamination in The Flesh and Gastrointestinal Tract of Nile Tilapia (Oreochromis niloticus) reared in Floating Net Cages at Lake Ranu Grati, Pasuruan, East Java, Indonesia
In recent years, microplastics (MPs) have emerged as a prominent environmental problem in waters and environments, including lake …
Aunurohim Aunurohim
,
Miftakhul Sefti Raufanda
,
Dian Saptarini
,
Farid Kamal Muzaki
,
Romanus Edy Prabowo
,
Martinus Surya Ari Pamungkas
,
Sobrian Cahya Perdana Putra
,
Ekawati Ekawati
,
Nur Maulidhaturrafida
,
Shinta Cahyaning Dewi
,
Edo Danilyan
PDF
DOI
biocomp: Github repository for learning biocomputations
Hi guys, biocomp is a repository for my bioinformatics and computational biology learning journey. This repository includes scripts and data primarily focused on computational biology, covering a wide range of topics such as:
Edo Danilyan
Code
»
Cite
×