Edo Danilyan
Edo Danilyan
Projects
Talks
Experience
Notes
Contact
data visualization
Flock Around and Find Out
A hackathon project for the Earth Information Jukebox challenge at NASA Space Apps Challenge 2026.
Edo Danilyan
,
Muhammad Noor Fakhruzzaman
,
Fauziyah
,
Arief Purnama Muharram
,
Muhammad Ikhsan
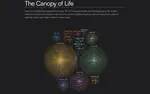
To See a Forest
My visual report contribution to the Kampar Peninsula Biodiversity iNaturalist citizen-science initiative, bringing together 10,461 sightings from 92 people.
Edo Danilyan
The Pacific's Broken Ring
An analysis of 358,673 earthquakes around the Pacific from 2000 to 2025.
Edo Danilyan
Explore story
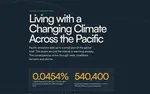
Living with a Changing Climate Across the Pacific
An analysis of emissions, ocean warming, cyclones, reef heat stress, rainfall, sea level, disasters, and electricity across the Pacific.
Edo Danilyan
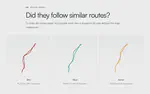
Bird Migration
Three gulls from the same coast left up to 78 days apart and wintered in different countries. Their journeys show how timing and stopovers can split a shared migration route.
Edo Danilyan
A Year in 22,197 Plays
I revisited my 2022 Spotify export as a diary instead of a pile of charts. The timeline traces a 123-day listening streak through my thesis, seven silent days, and the change in rhythm when I moved from Surabaya to Poland.
Edo Danilyan
Story
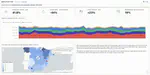
Spain Energy Generation Dashboard
Welcome! I came across this Kaggle dataset on Spain’s electricity generation and thought it would be fun to turn it into something a little more interactive. Instead of staring at rows of numbers, I wanted a way to explore how the country’s energy mix has changed over time and see how different energy sources compare.
Edo Danilyan
Dashboard
Storytelling with Data
A session on how to tell better stories using data, tailored for faculty and researchers at UMM.
Apr 21, 2026 9:00 AM — 12:00 PM
Universitas Muhammadiyah Malang
Edo Danilyan
Project
CoE GAP Project
LinkedIn Post
Where should we plant mangroves?
Mangrove restoration involves difficult decisions because land, funding, and time are limited. Spatial analysis can help identify where restoration may provide the greatest ecological and social benefits. With those constraints in mind, where should mangroves be planted first?
Edo Danilyan
,
Afthoni Nur Fuadi
Last updated on Oct 28, 2026
3 min read
R tutorial series: Choosing color for data visualization
A practical guide to categorical, sequential, and diverging color palettes in R, with visible swatches and reproducible ggplot2 examples.
Edo Danilyan
Last updated on Oct 28, 2026
5 min read
»
Cite
×