Shinyapp for biologist: apps and usage tutorial
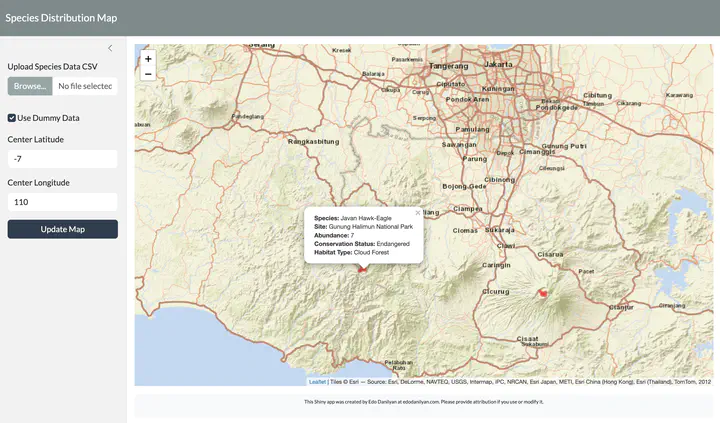
Welcome! This is my first R Shiny project, a simple app for mapping species observation data.
You upload a CSV with one row per observation (species name, site, abundance, latitude/longitude, conservation status, and habitat type), or tick a box to try it with built-in dummy data on Javan wildlife. The app then plots each observation as a circle on a leaflet map, centered on coordinates you choose, with a popup showing the species, site, abundance, conservation status, and habitat type on click.
You can explore the code and try it yourself here:
GitHub Repo
It’s still a work in progress, built mainly so field researchers and students can visualize their own biodiversity data without writing any code.
Why I Built This
As a biologist, I often wished for lightweight, user-friendly tools that didn’t require advanced programming knowledge to analyze spatial biodiversity data. Shiny gives us a way to build just that interactive dashboards powered by R.
I hope these apps can help others explore their ecological data more intuitively, even as I continue to refine and expand their features.
Let’s Collaborate
Interested in using or customizing these apps for your own work? Want to build something together?
I’m open to collaborations, projects, or teaching opportunities.
Let’s get in touch!