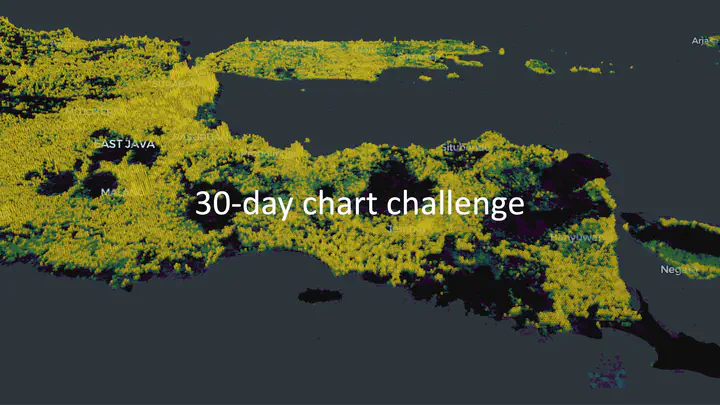
Welcome! This is a friendly and beginner-accessible open-source book created to help you explore the fascinating world of data visualization, one chart at a time.
Through this project, I share:
- My personal contributions to the 30 Day Chart Challenge
- Step-by-step R tutorials
- Clean, reproducible code
- Practical tips for making compelling and effective charts
Whether you’re just starting your data journey or looking to sharpen your data storytelling skills, this book is designed to guide you in an approachable, hands-on way.
Let’s turn data into stories—together.
Check out the full project here:
Read the tutorials
Browse the code on GitHub
Let’s Connect
Always happy to meet new people, swap ideas, talk science, design, data, or whatever else we find interesting.