Test R Post
x <- 1:10
mean(x)
## [1] 5.5plot(x, x^2,
main = "X vs X squared",
xlab = "X",
ylab = "X²",
col = "blue",
pch = 19)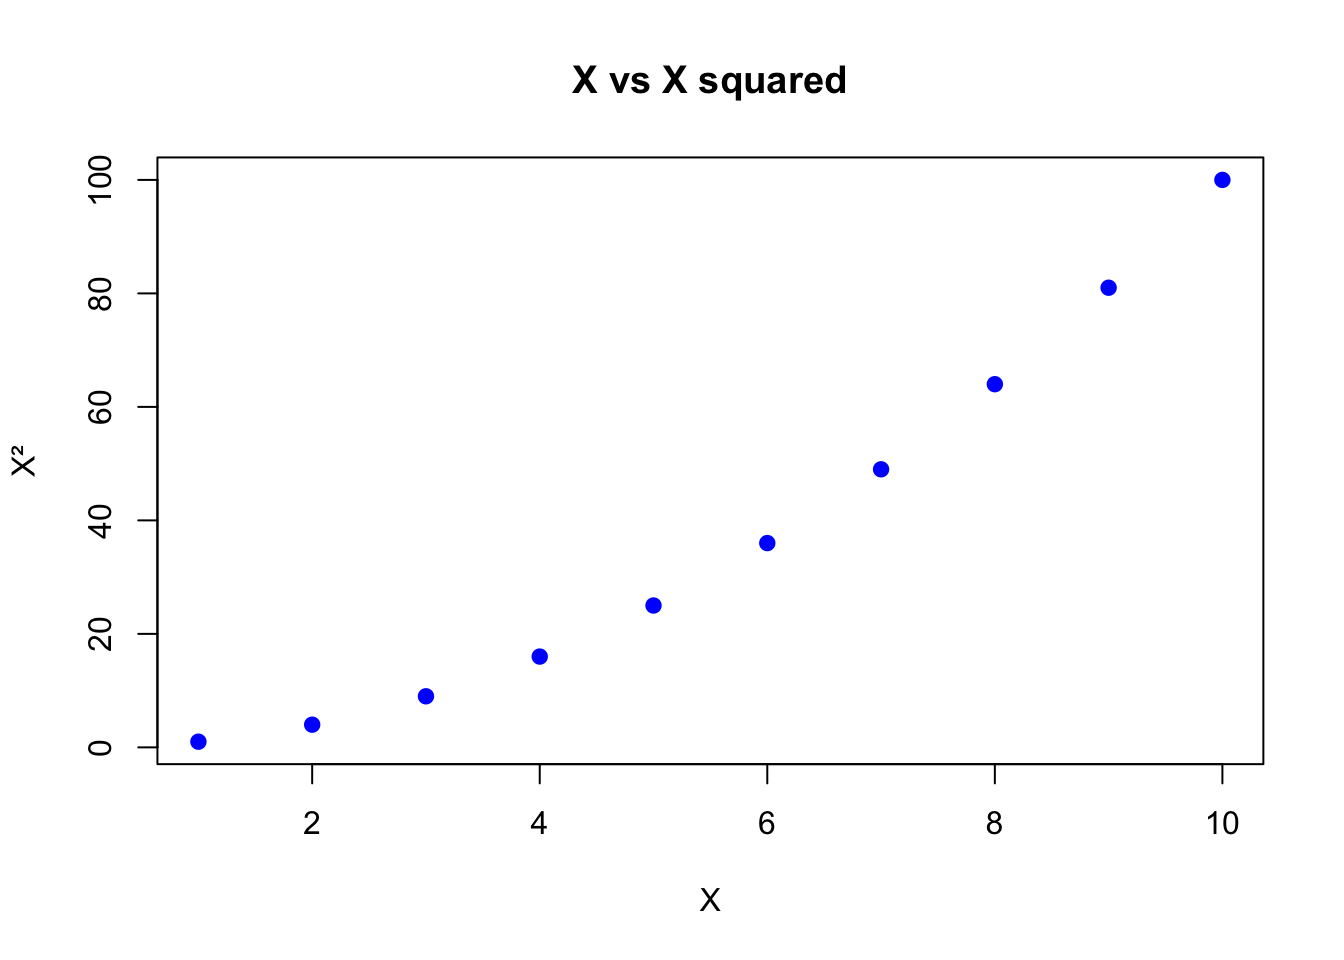
The mean is 5.5 and the plot is generated automatically!
x <- 1:10
mean(x)## [1] 5.5plot(x, x^2,
main = "X vs X squared",
xlab = "X",
ylab = "X²",
col = "blue",
pch = 19)
The mean is 5.5 and the plot is generated automatically!