I Learned R Backwards, and Somehow It Worked
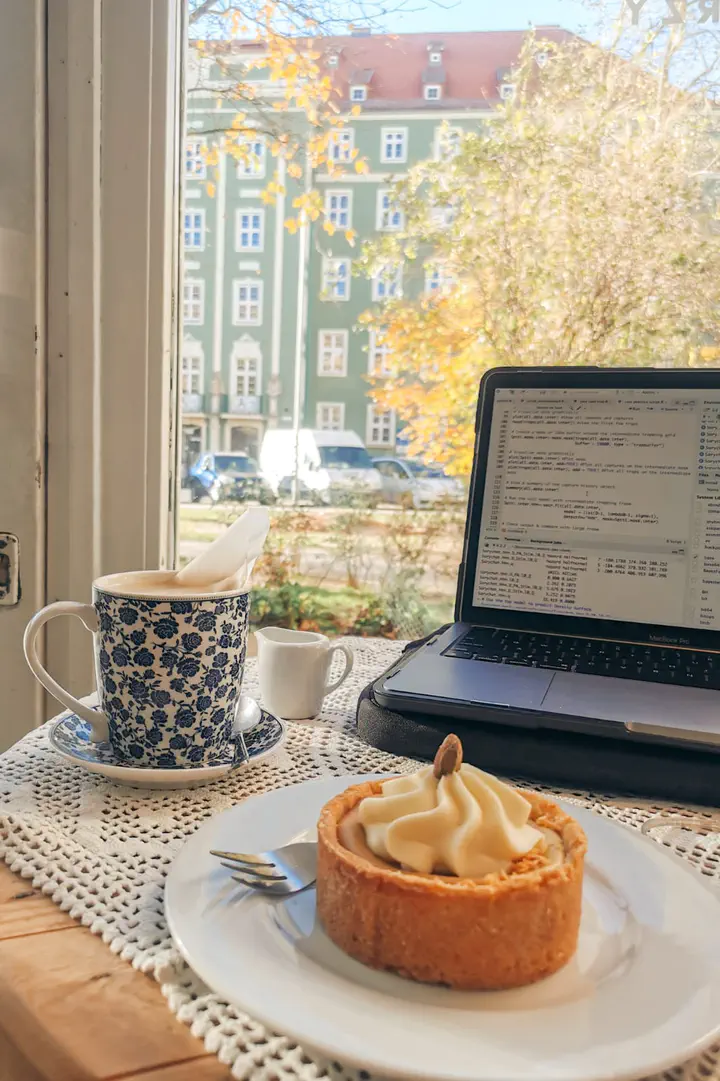
I did not start learning R because I had a carefully planned career goal. I started because, during my time at Chulalongkorn University in 2020, my labmates were using it for their master’s thesis analyses and I had no idea what they were doing.
They could turn messy biological data into figures and statistical results by writing a few lines of code. I was curious, impressed, and if I am being honest, a little worried about being left behind. So I installed R and RStudio and decided to make a graph.
This was my first mistake.
Starting in the wrong place
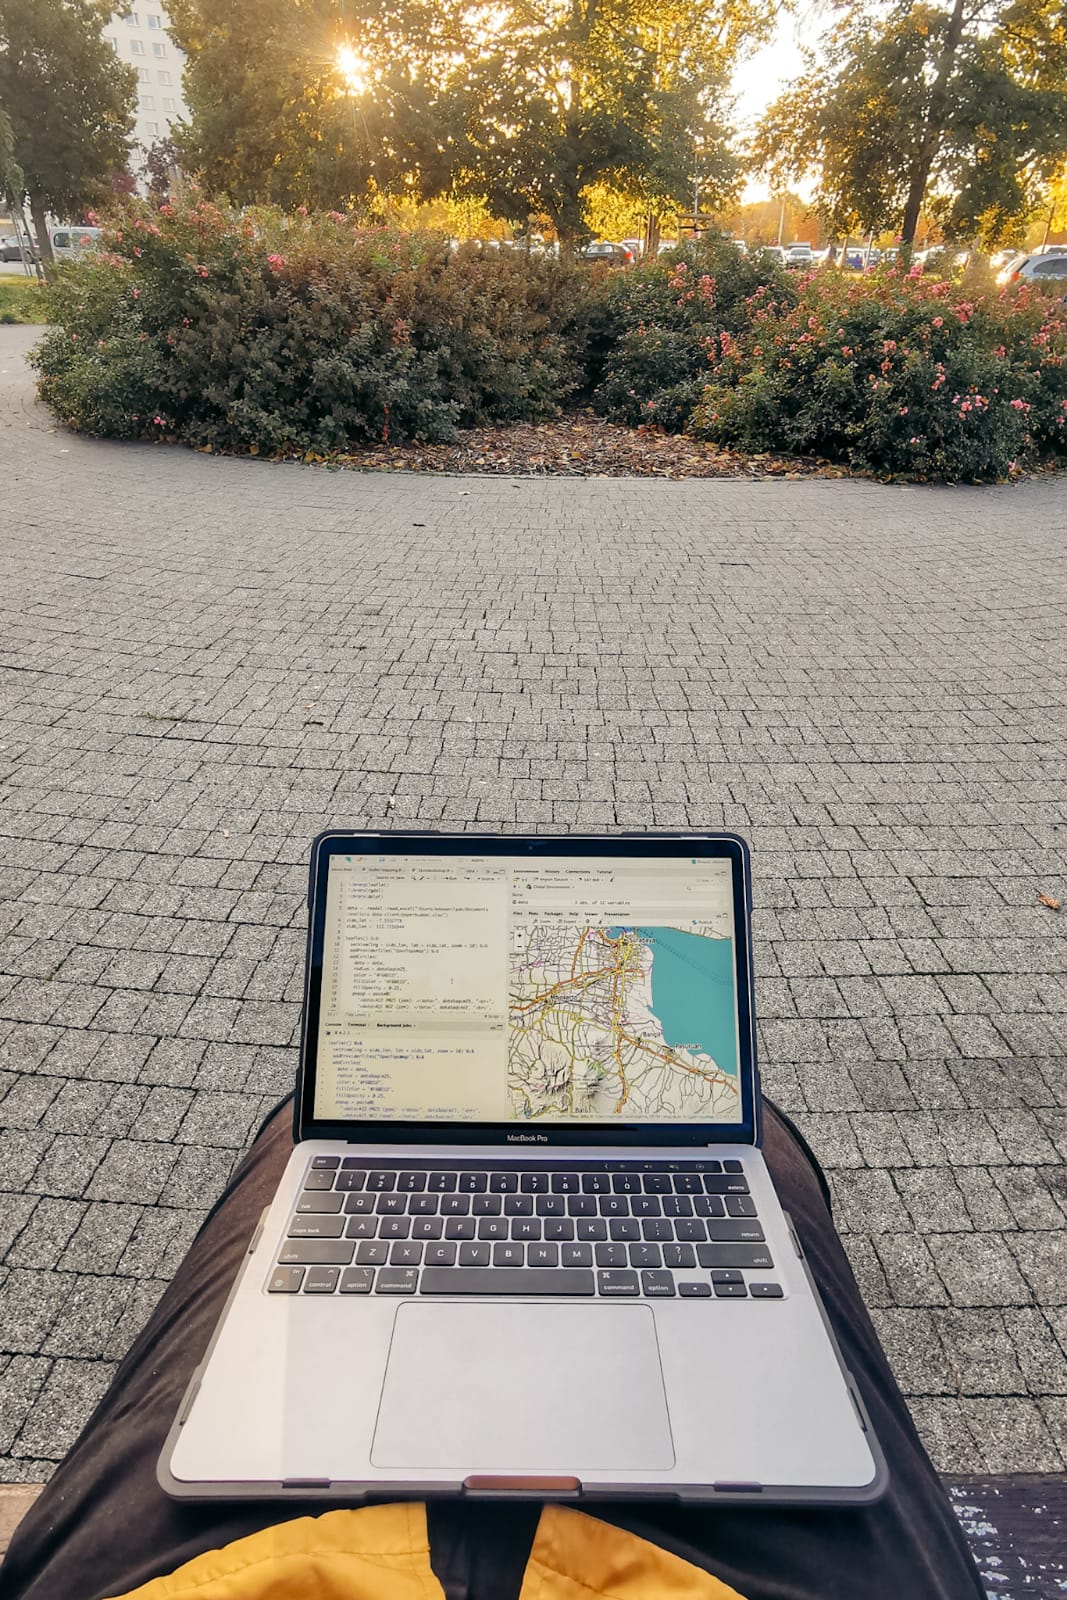
At that point, I did not know the difference between wide and long data. I did not know how to import a dataset properly. Words like function, object, and argument meant almost nothing to me. Before I could even produce a bad graph, I got stuck trying to install a package, lol.
I had treated R like another piece of software: install it, click around, and eventually something useful will appear. R does not really work that way. Once I accepted that I needed to learn some basics first, I enrolled in an introductory R for Data Science course on edX. It covered variables, data types, functions, syntax, and data manipulation. None of this felt exciting at first, I still wanted to skip ahead and make pretty plots, but it gave me a map of what I was looking at inside RStudio.
Coming from biology, even simple programming ideas took time to settle in my head. A loop looked unnecessarily complicated. Conditional statements felt like riddles. Error messages looked hostile, especially when I had no idea which part of the message mattered. Sometimes I would spend an hour on a problem caused by one missing comma or a column name typed with the wrong capitalization. IT’S REAL.
What helped was working on small things I actually cared about. Random exercises could teach me syntax, but a real dataset gave me a reason to keep going. I would find someone else’s code, run it, change one part, break it, and try to understand why. Slowly, error messages stopped looking like personal attacks and started becoming clues.
The point when R became useful
The real turning point was a metagenomics project. The dataset was large and required far more wrangling and manipulation than anything I had handled before. For the first time, R was not a course I was trying to finish. It was the tool I needed to answer a biological question.
When the analysis finally worked, I could see the distance between that project and the person who once got stuck installing a package. I would not call the code elegant, and I am sure I could write it much better now, but it worked.
After that, curiosity took over. I moved from data manipulation into visualization and statistical modelling, then kept finding packages that made me want to try something new: gganimate, ggplotly, highcharter, flextable, flexdashboard, rayshader, spatstat, and many others. Every package suggested another kind of question I could ask or another unnecessarily fancy plot I could make at 1 AM.
Stack Overflow, forums, social media groups, and other people’s GitHub repositories were a huge part of this process. Most of the time, someone had already encountered my error. The difficult part was learning how to describe the problem well enough to find their answer.
What I wish I had done earlier
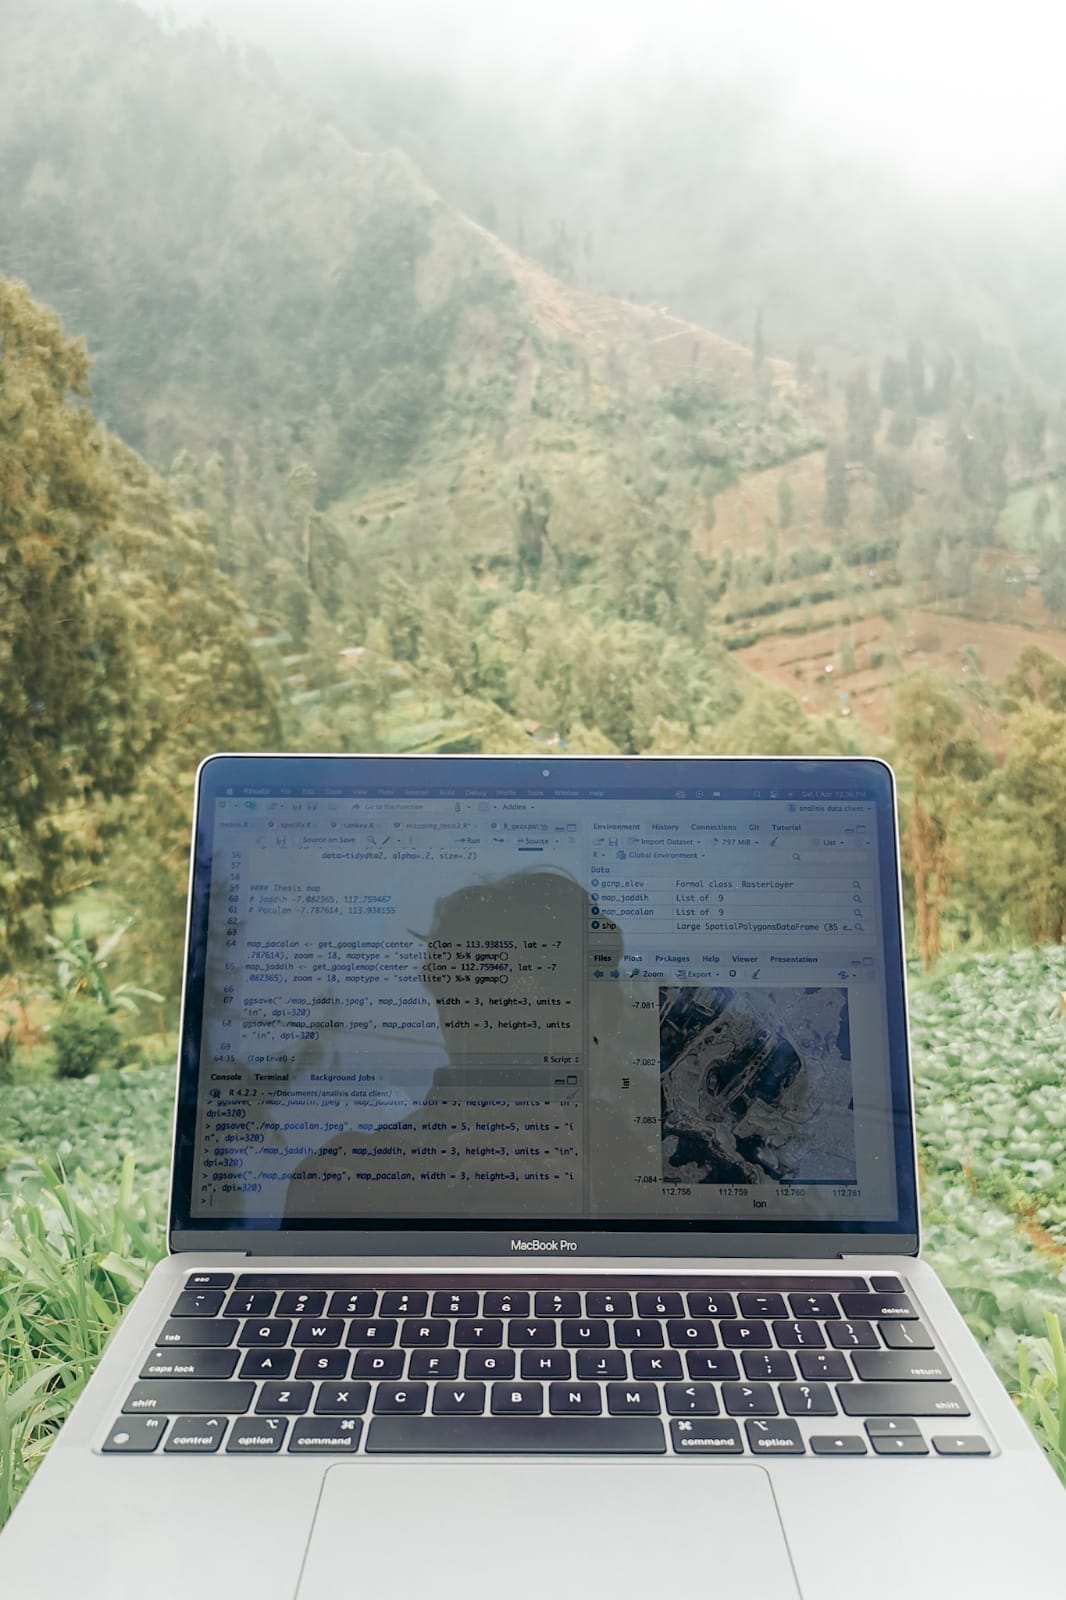
If you are a biologist opening RStudio for the first time, do not begin with loops or advanced statistics. Learn how R sees data. Understand rows, columns, data types, missing values, and especially the difference between wide and long formats. Learn how to import a file and inspect it before trying to analyse it. I skipped this part and made everything harder for myself.
Then choose a small project with an output you genuinely want. A visualization is a good place to start because you can immediately see what your code changed. Get comfortable with dplyr, tidyr, and ggplot2; together, they cover a large part of the work many new R users want to do.
When something breaks, read the entire error message before copying it into Google. Check the line R points to, but also look at the line before it. Search using the package name and the important part of the error. If the first explanation makes no sense, find another one. Stack Overflow and the RStudio Community are useful, and #TidyTuesday offers plenty of datasets and examples to take apart.
Most importantly, read code written by other people. Run it, modify it, and see what changes. I learned much more by breaking working code than by staring at a blank script and trying to remember the correct syntax.
Courses can give you structure but you do not need to wait until you complete a curriculum before working on something real. And if you need a very specific explanation for free, there is probably a random Indian guy on YouTube who has already saved thousands of students :D.

Where it led me
Learning R has brought me into projects I would not have been able to take on before. Those personal and professional projects eventually became part of my portfolio, but the bigger change is how I approach data now. When I encounter a messy dataset, my first reaction is no longer, “I have no idea how to do this.” It is, “Okay, how can I break this into smaller problems?”
I learned R in a messy, inefficient order. I copied code I barely understood, produced errors I could not explain, and definitely made some ugly graphs. Still, each project left me knowing a little more than the previous one and i think that is enough.
I believe in sharing code, so feel free to visit my GitHub. If you are also learning R from a biology background, I would be glad to hear what you are working on or what error message is currently ruining your day.
Cheers, I’ll see you in the next one!