Dashboard Collection and Presentation Slides Samples
Exploratory data analytics using dashboard as a reporting medium and slides I have created for a presentation
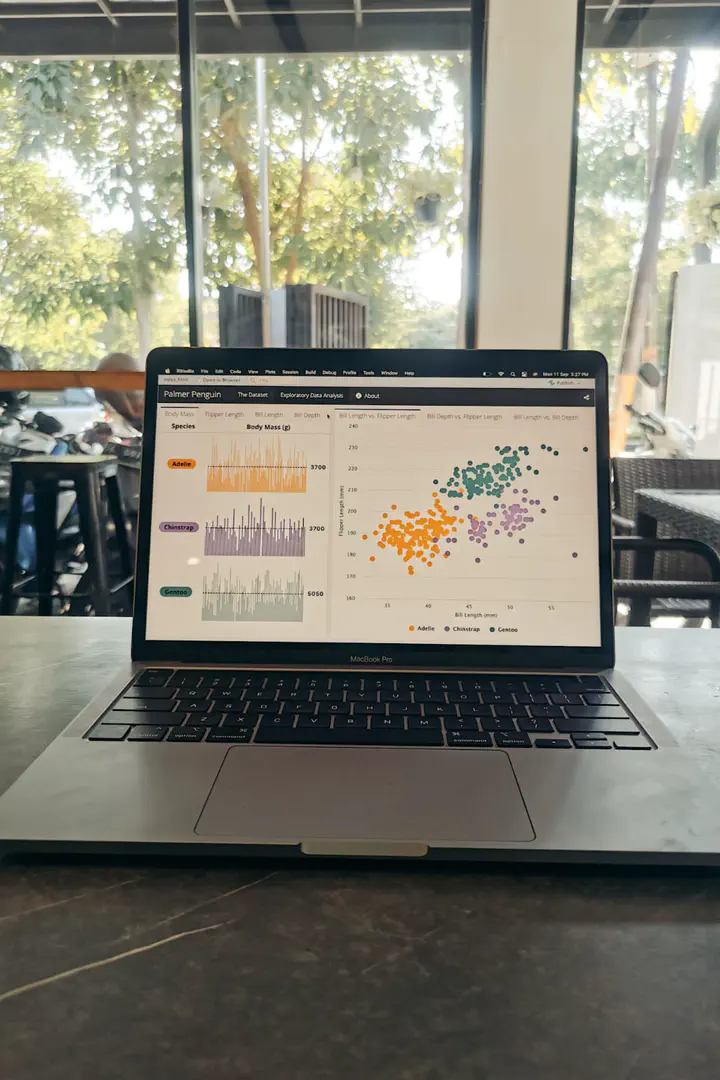
Overview
I primarily use R Studio IDE for Exploratory Data Analysis, visualization, and statistical analysis. In this collection, I listed some of my dashboard created using flexdashboard package. This package allow me to visualise a dashboard using Rmd format. flexdashboard allow flexibility of many different packagses such as ggplot, ggplotly, plotly, gttable, highcharter and many more.
To use flexdashboard, install the flexdashboard package from CRAN as follows:
install.packages("flexdashboard")
You can also use the development version of the flexdashboard package by installing the package from GitHub via the remotes package:
remotes::install_github('rstudio/flexdashboard')
Dashboard Collection
Tetanus Infection.
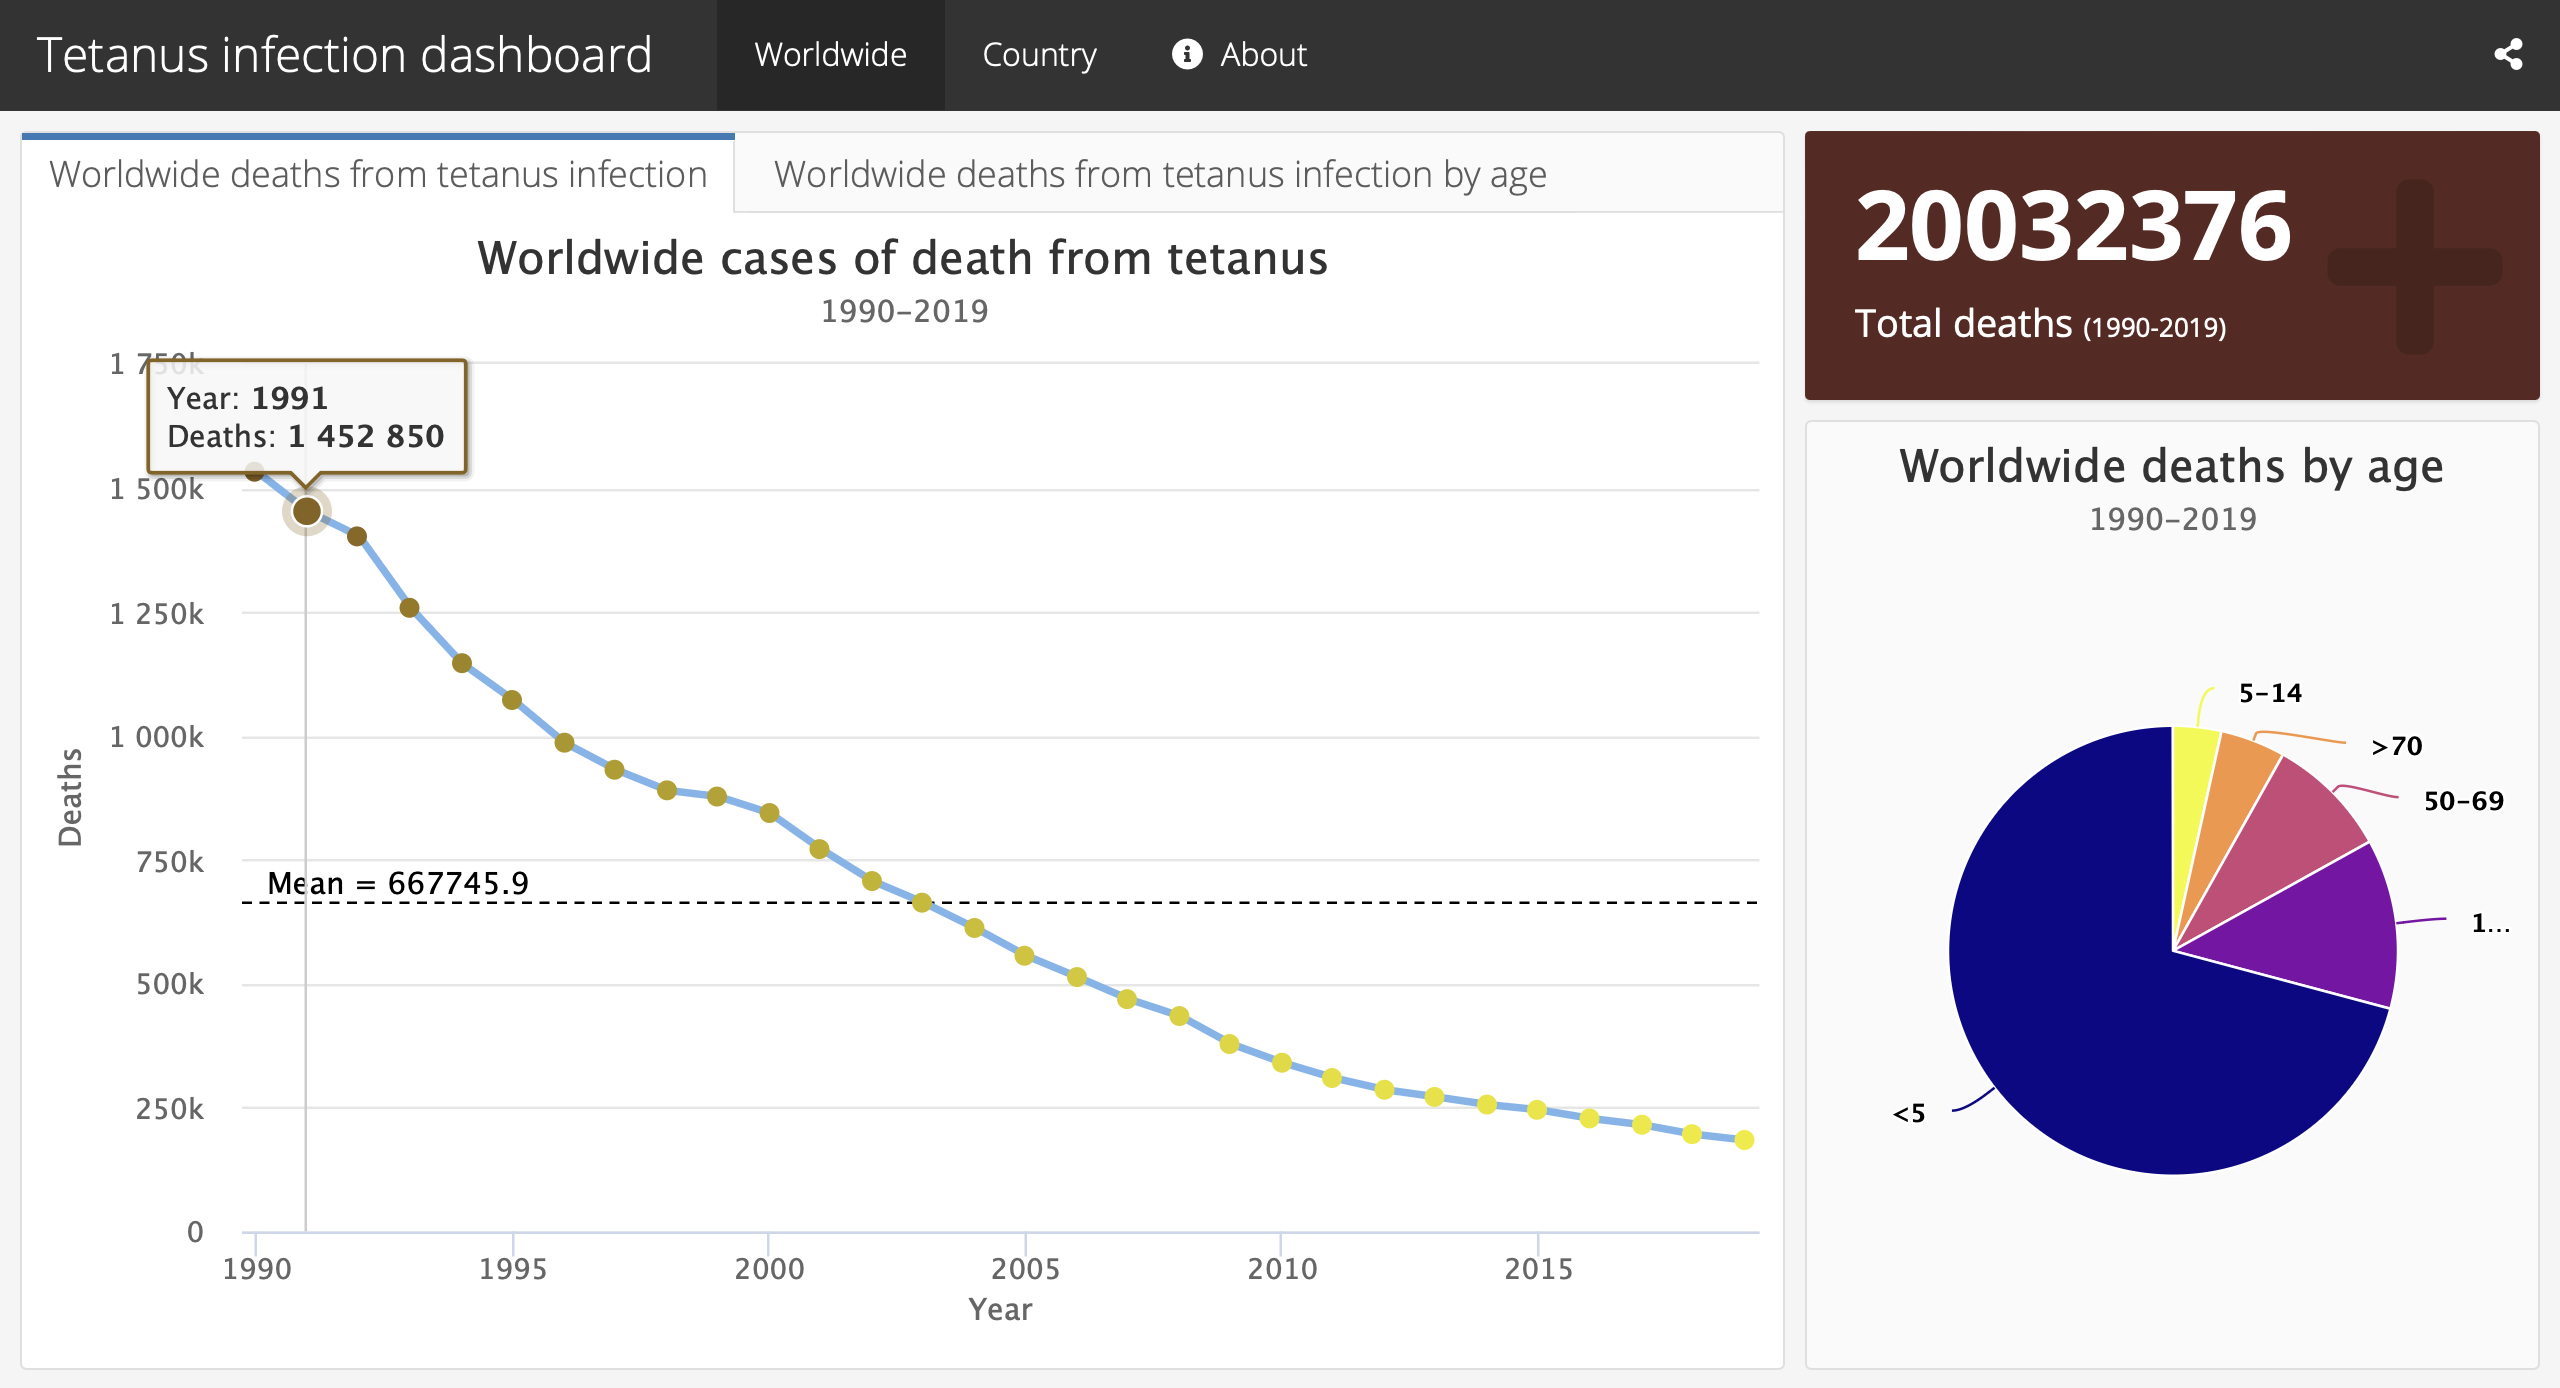
Web view of Tetanus Infection Dashboard Palmer Penguins.
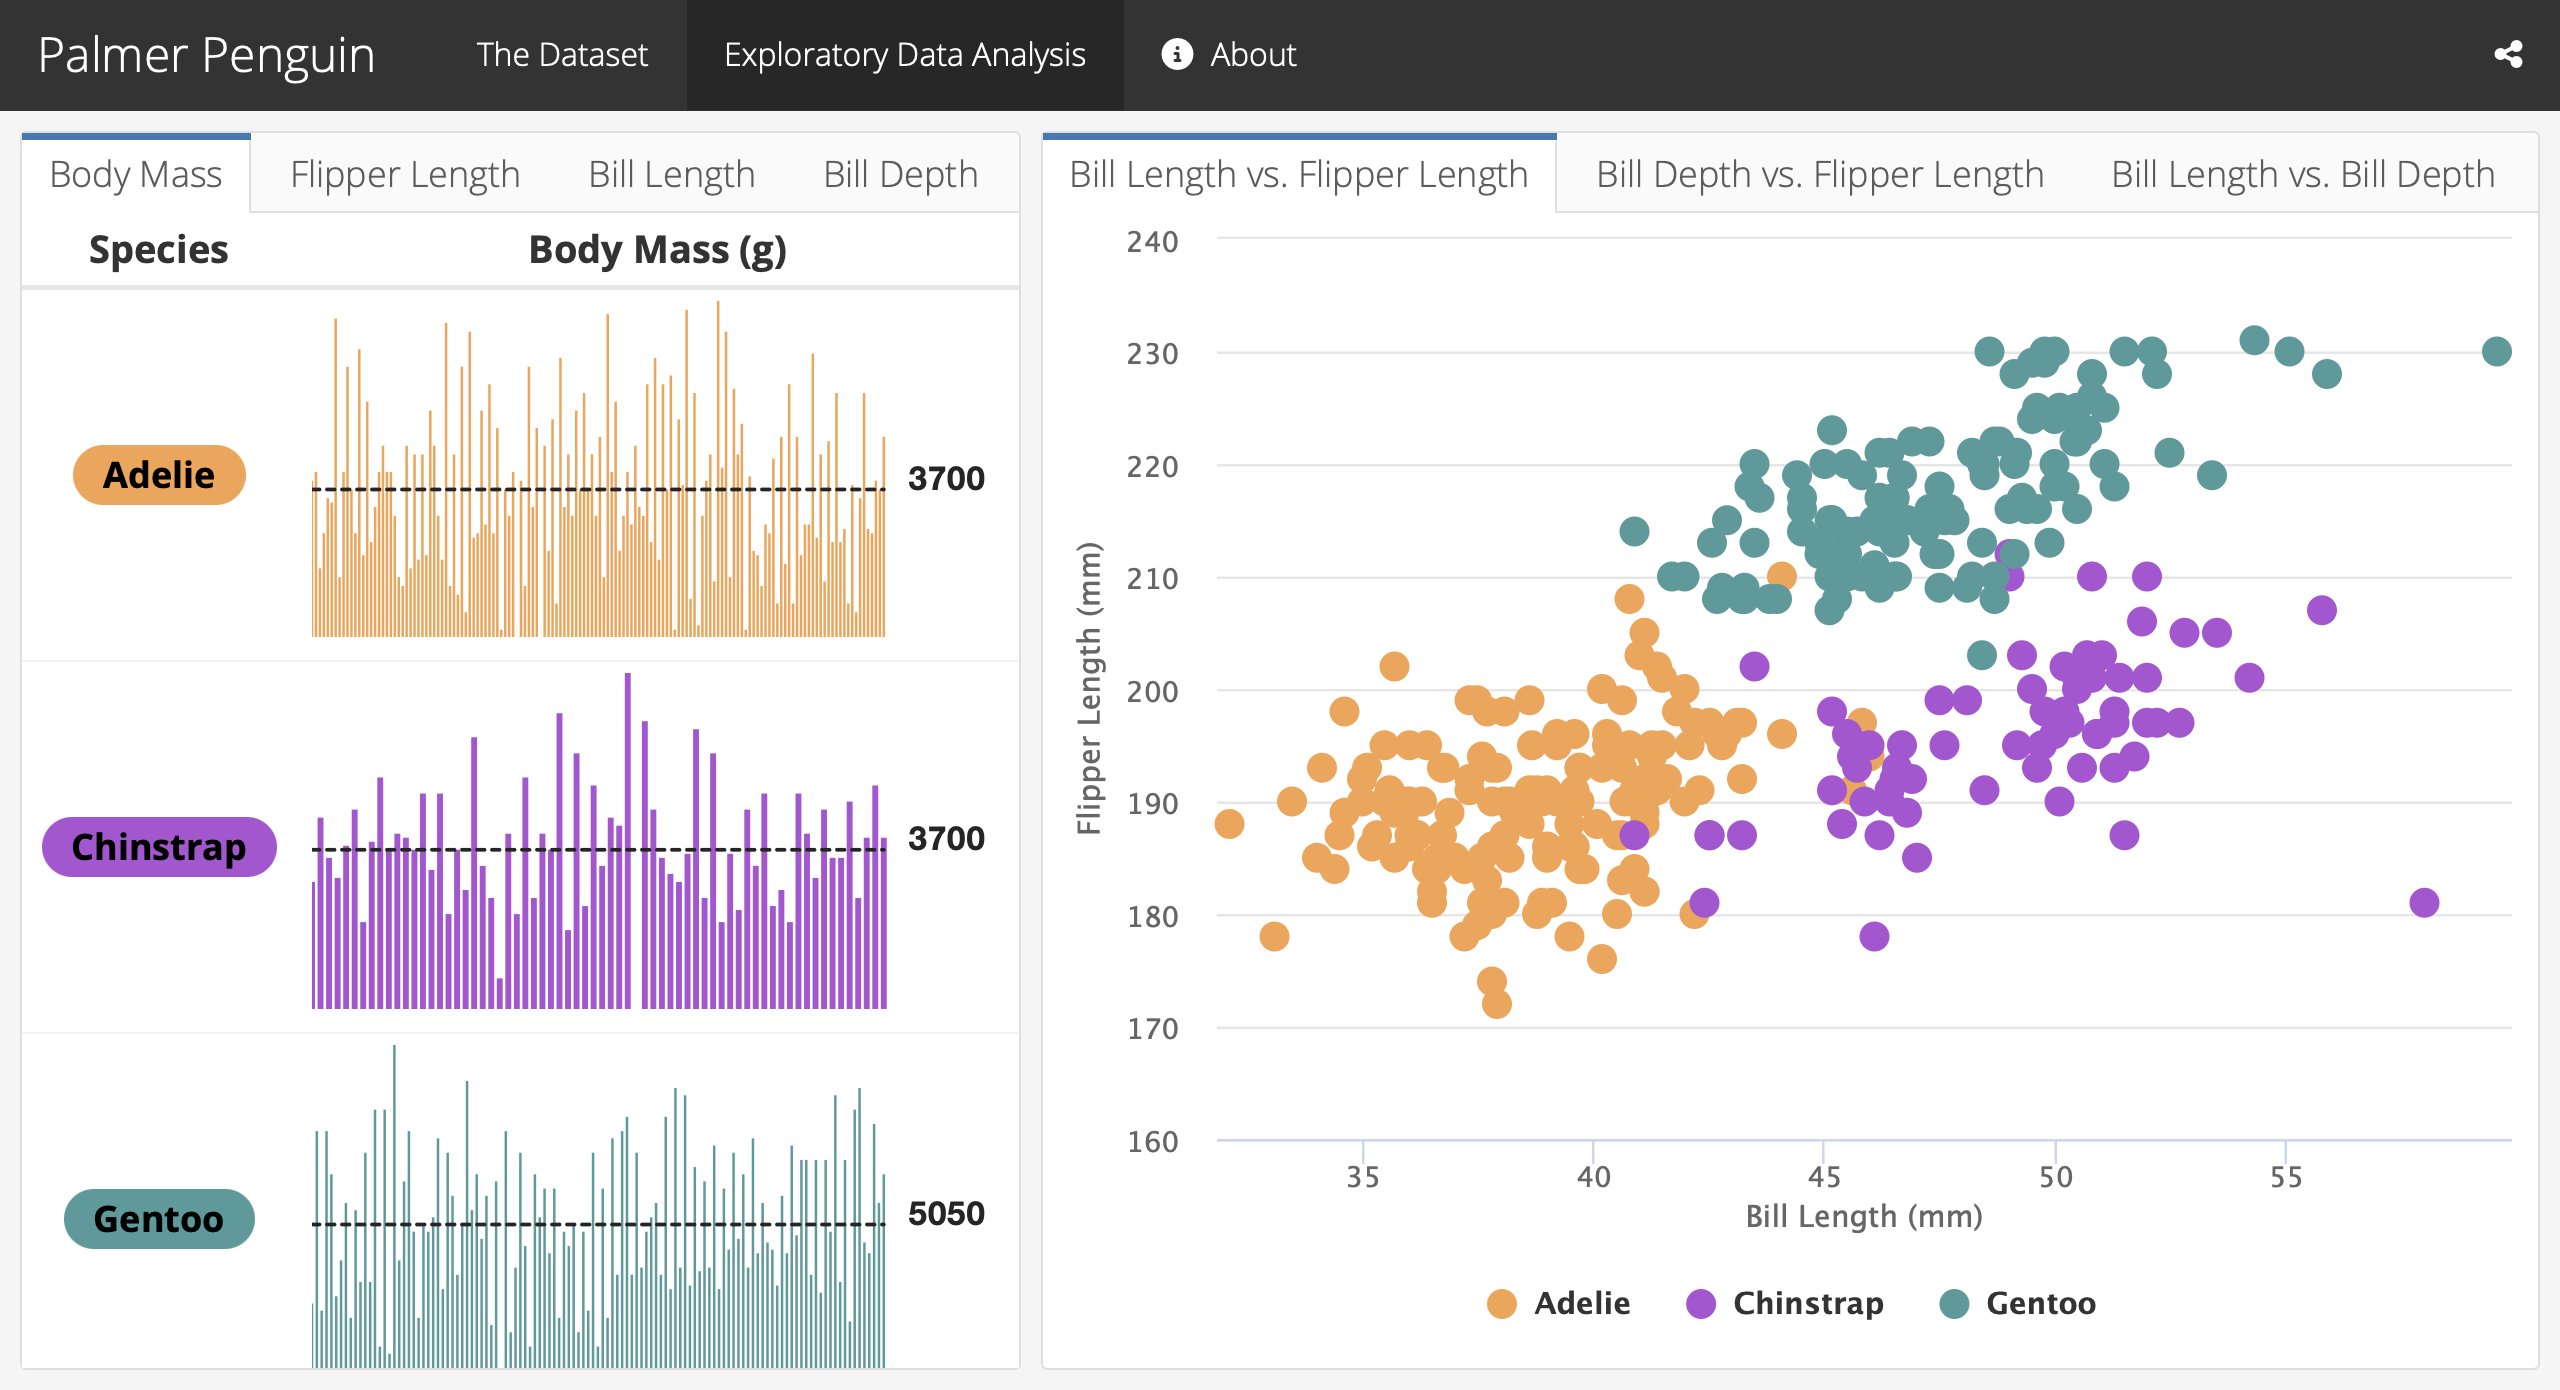
Web view of Palmer Penguins Dashboard