Curious about data, technology, and the natural world
Hi there, I’m Edo. I study living systems and explain complex things through data, code, and visual storytelling. I like good company and bad ideas in equal measure. Experiments, code, cameras, and questionable life choices all end up here sooner or later. Tho I’m still convinced this all makes sense.
Some weeks that means a new dashboard or a photo from the field. Other weeks it’s just one plot I’m proud of, or a page I forgot to update for a year. Things got out of hand here long before anyone started calling it a website. Poke around: there’s code if that’s your thing, research for a closer look at my academic work, and a photography portfolio featuring field, nature, and landscape work. If something catches your interest, I’d be glad to hear from you.
Focus
Interests
Background
Education
- 2024–present
PhD in Microbiology and Environmental Science
Centre for Microbiology and Environmental System Science, Universität Wien
- 2021-2023
MSc in Biology
Institut Teknologi Sepuluh Nopember
- 2018-2022
BSc in Biology
Institut Teknologi Sepuluh Nopember
Featured Projects
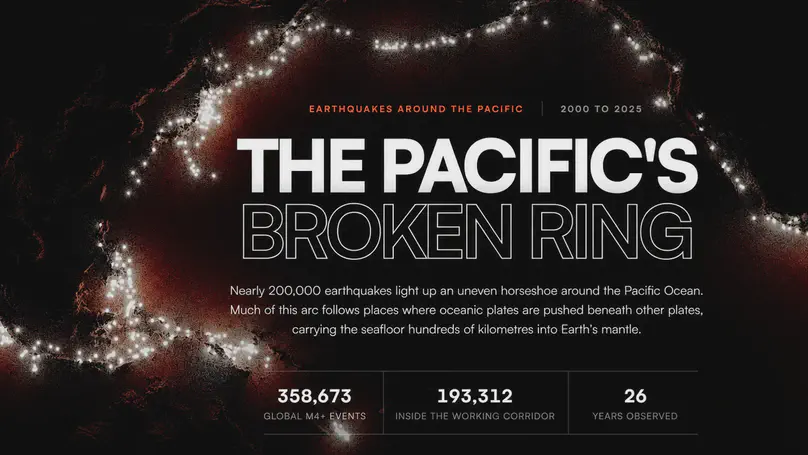
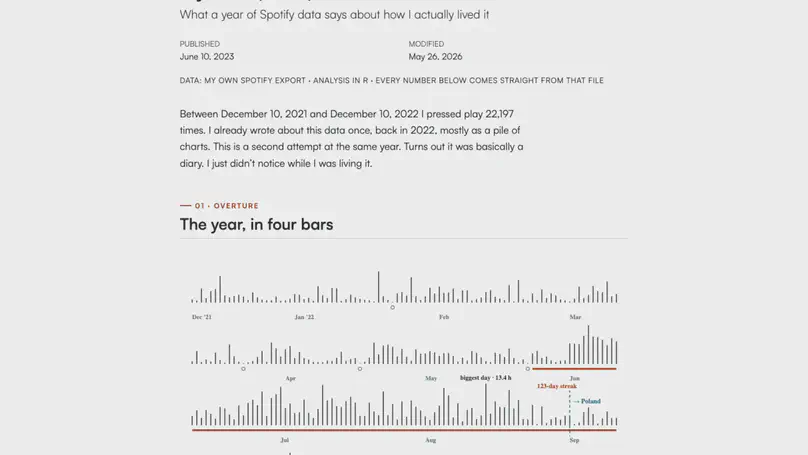
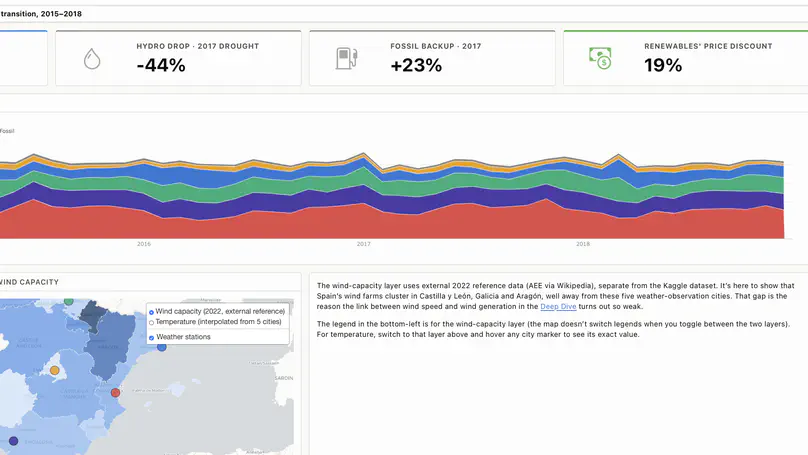
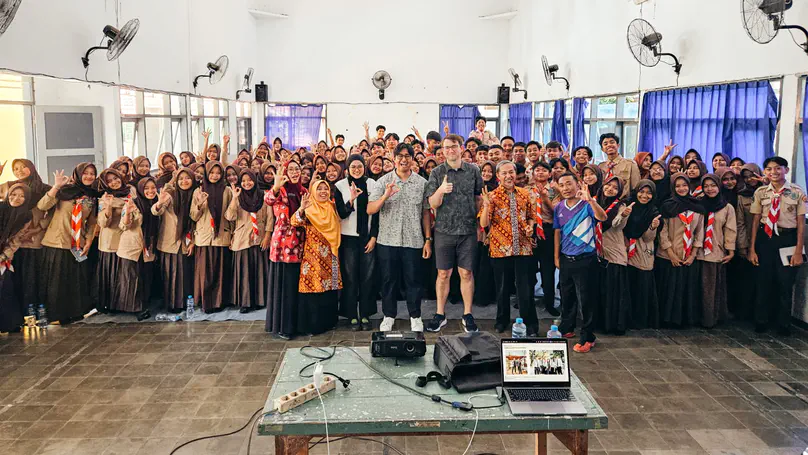
A selection of recent research, outreach, and data work
Skills
Tools and ways of working that connect research, data, and visual storytelling
Reproducible analysis, statistical programming, advanced visualization, automated reporting, and interactive data applications
Statistical modelling, experimental design, multivariate analysis, hypothesis testing, and clear interpretation of complex data
Documentary, field, landscape, and portrait photography focused on science, nature, people, and place
Come to say hi
Good ideas often start with a conversation
Research, data, visualization, collaboration, half formed ideas, or just something interesting you want to talk about. If you think we might have something to discuss, I’d love to hear from you.